Traffic is not the goal
Traffic is no longer the clearest sign that content is working.
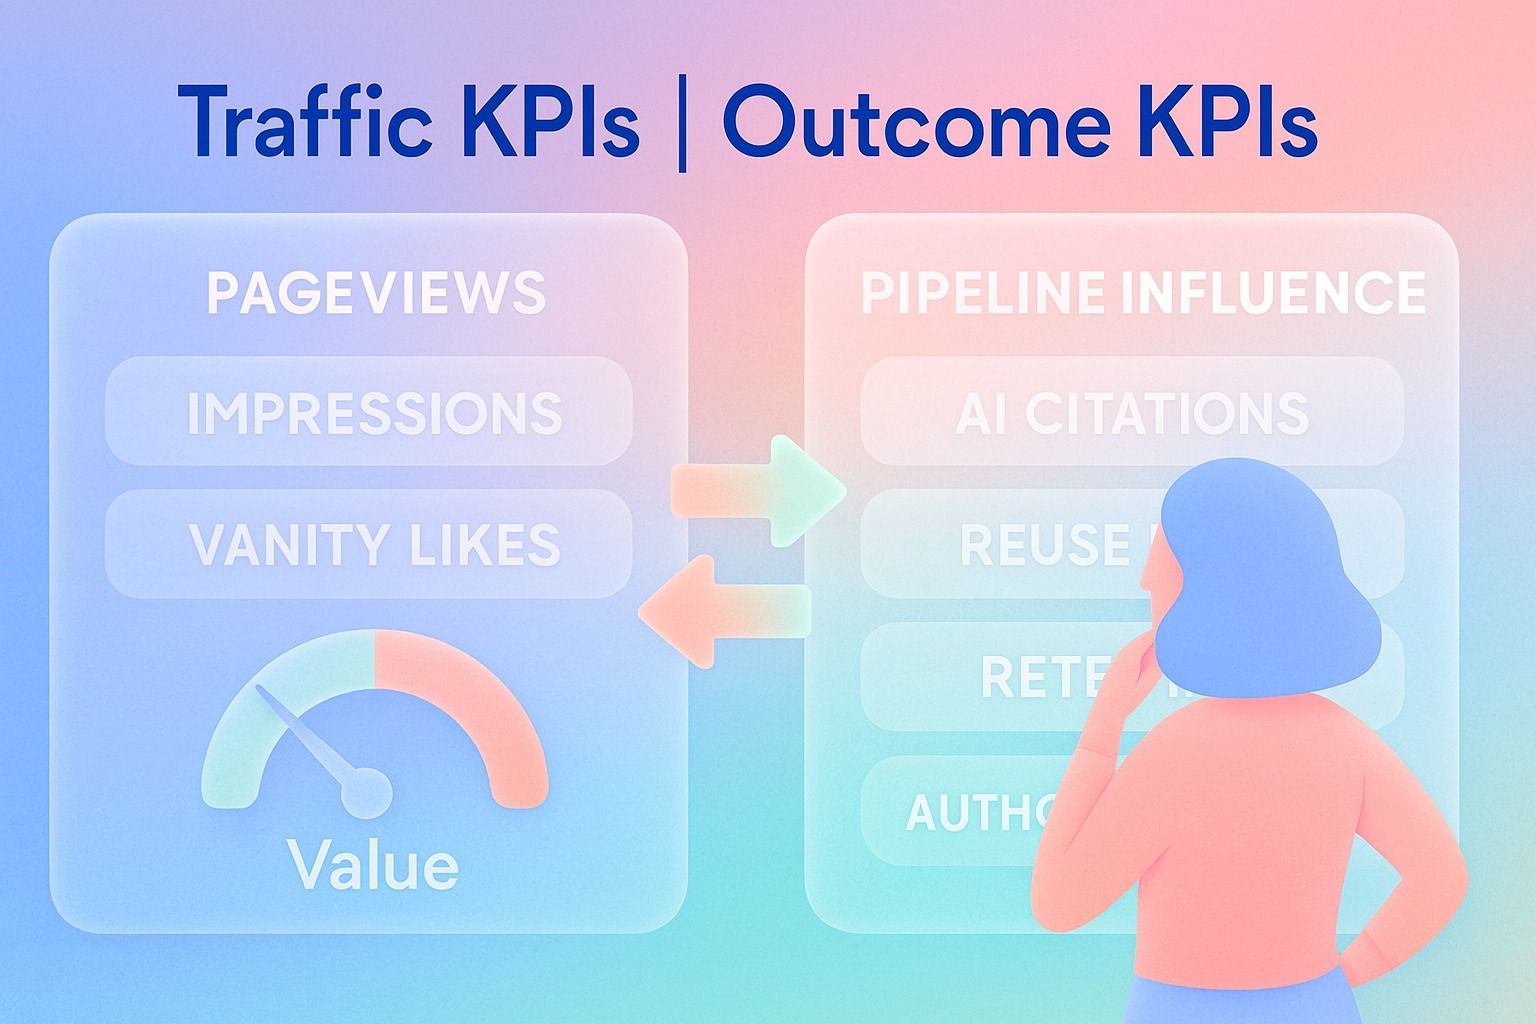
In 2026, the best content teams measure what content does, not just how many people land on a page. That means tracking whether content influences pipeline, earns AI citations, gets reused across channels and sales touchpoints, improves retention, and creates compounding authority over time.
If your dashboard still starts and ends with pageviews, impressions, and vanity engagement, you are probably undervaluing your highest-impact content.
The shift is simple: content should be measured like a business asset, not a publishing event.
If you also want your LinkedIn workflow to support that shift, Dynal can help you turn ideas into structured posts, planned content, and lightweight LinkedIn analytics in one place. It is built as an AI LinkedIn agent, so the goal is to connect creation with the business outcomes you are trying to measure.
What matters now
- Measure contribution to pipeline, not just visits.
- Track AI citations and source visibility, not just rankings.
- Score content reuse, retention support, and sales enablement value.
- Tie LinkedIn post-performance analytics to decisions, not just reporting.
Why traffic is becoming a weaker primary KPI
Traffic still matters. It can signal discoverability, topic demand, and distribution strength. But by itself, traffic tells you very little about business value.
A page can attract thousands of visits and still fail to:
- generate qualified conversations
- support pipeline content
- earn trusted mentions in AI answers
- help sales teams close deals
- improve customer retention
- reinforce your brand context consistently across channels and teams
At the same time, some of the most valuable content in 2026 may have modest traffic and still outperform your "top" posts. Think product explainers used by sales, founder perspective posts that drive high-quality inbound, or category content that gets referenced in AI systems and internal buying conversations.
That is why content metrics need to move from reach-first to outcome-first.
What content metrics matter more than traffic in 2026?
Here are the content metrics that deserve more attention than raw traffic alone.
1. Pipeline influence
This is the most important shift.
Instead of asking, "How many visits did this content get?" ask:
- Did this content assist qualified leads?
- Did it influence demo requests, sales conversations, or deal progression?
- Was it used in nurture, outbound, or follow-up sequences?
- Did it attract the right audience, not just a large audience?
Useful pipeline content metrics include:
- influenced opportunities
- sales-qualified leads touched by content
- meetings booked after content exposure
- assisted conversions
- content-sourced conversations
- opportunity progression rate after content engagement
2. Content ROI
Content ROI is no longer just leads divided by cost.
A stronger 2026 view includes:
- creation cost
- distribution cost
- reuse value
- sales enablement value
- retention value
- authority value from citations and references
In other words, one content asset may create returns in multiple places even if direct last-click attribution is low.
3. AI citations
As AI search and answer engines shape discovery, citation becomes a real performance layer.
Good questions to ask:
- Is your content being referenced in AI-generated answers?
- Are your brand and experts being cited as sources?
- Which topics earn mentions most often?
- Which pages are most likely to become source material?
AI citations are not identical to backlinks, but they can become an important authority signal because they indicate your content is being selected as a useful source.
4. Reuse rate
High-performing content is increasingly modular.
Instead of producing one blog post and moving on, strong teams ask:
- Can this become LinkedIn posts?
- Can sales reuse it in follow-ups?
- Can customer success send it to active accounts?
- Can it support onboarding, retention, or expansion?
A high reuse rate often signals that content is strategically useful, not just publishable.
5. Retention and customer impact
Not all content exists to acquire traffic.
Some of the best content:
- reduces confusion
- improves product understanding
- reinforces positioning after purchase
- supports adoption and expansion
- helps customers explain your value internally
If content helps existing customers stay, succeed, or buy more, it deserves measurement.
6. Audience-fit quality
Traffic without audience-fit is expensive noise.
Measure:
- percentage of visits from target accounts or target roles
- conversion rate by audience segment
- engagement quality from ideal customer profiles
- inbound quality from content-led touchpoints
7. LinkedIn post-performance signals that guide the next decision
For LinkedIn-led content strategies, post-performance analytics still matter, but the emphasis should be practical.
What should you be looking for?
- Which themes generate qualified conversations?
- Which angles produce saves, replies, and profile visits from the right audience?
- Which formats create follow-up actions, not just likes?
- Which posts deserve repurposing into longer-form pipeline content?
This is where a lightweight analytics workflow can help teams review post, engagement, and audience patterns without treating social metrics as the finish line.
Dynal’s Analytics surface fits this role well as a lightweight way to inspect LinkedIn content performance across overview, post, engagement, and audience views.
If you are building a LinkedIn-first measurement system, Dynal gives you a practical way to review performance and keep the content loop tied to your next planning decision. As an AI LinkedIn agent, it sits between drafting and analysis rather than replacing either one.
How do I measure content ROI beyond pageviews and impressions?
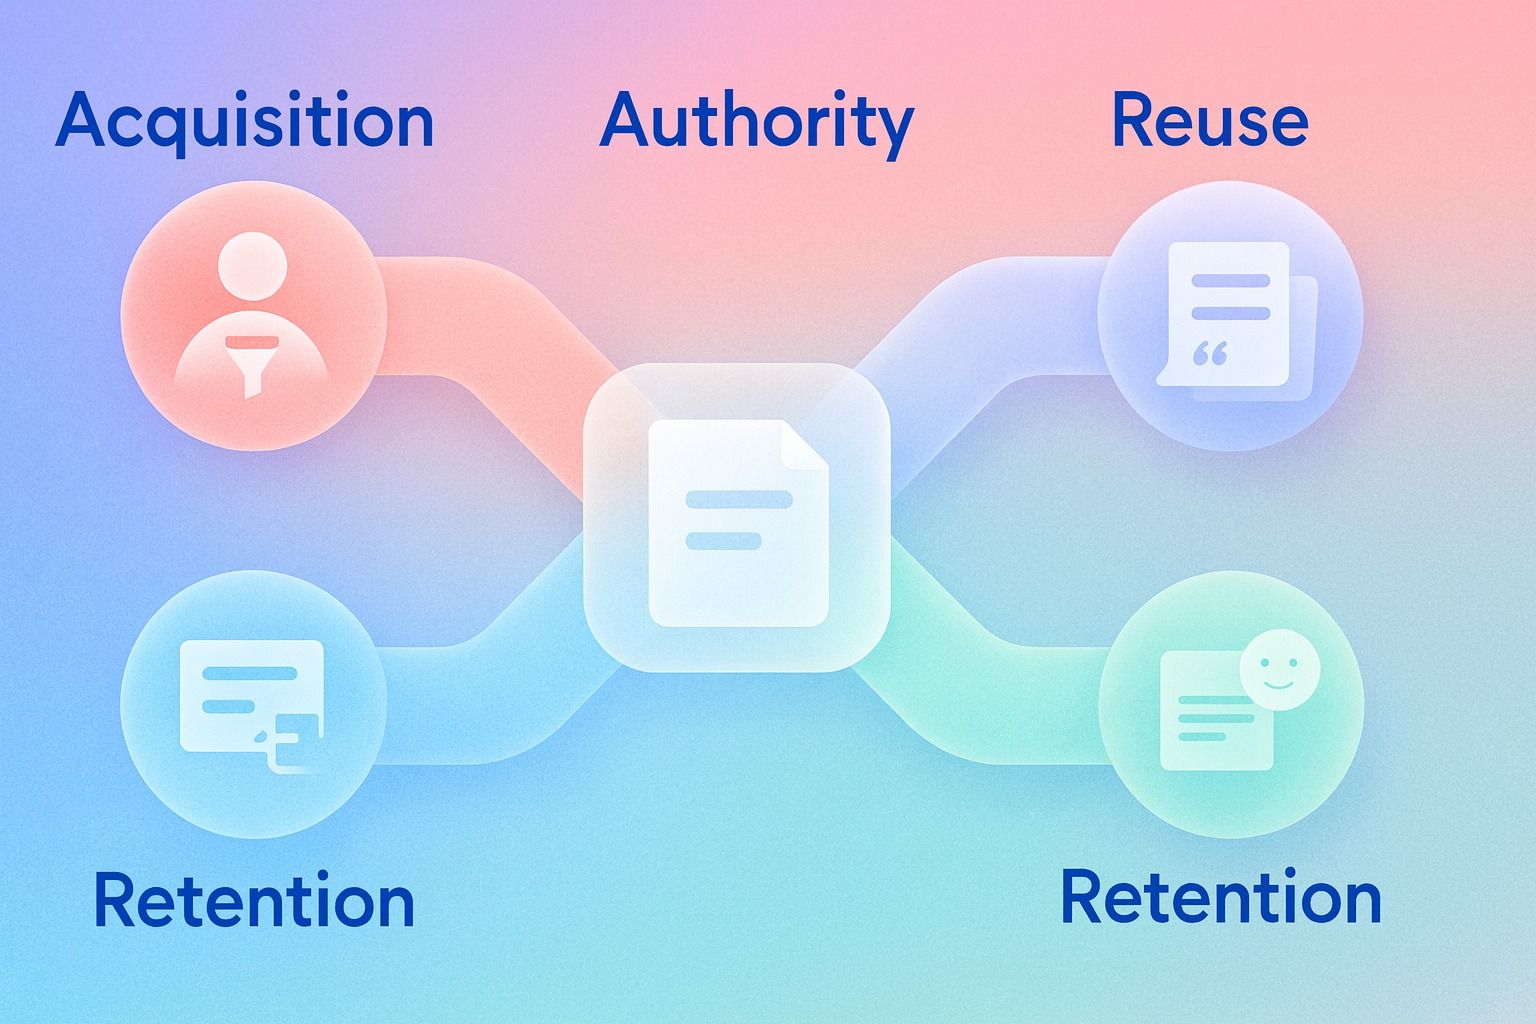
Start by separating content outcomes into four buckets.
A simple content ROI model for 2026
1. Acquisition value
Measure whether content creates or assists new business.
Track:
- content-sourced leads
- influenced pipeline
- assisted conversions
- meetings booked
- cost per qualified opportunity influenced
2. Authority value
Measure whether content increases trust and discoverability.
Track:
- AI citations
- backlinks and mentions
- branded search lift
- executive visibility
- invitations, partnerships, and media requests influenced by content
3. Reuse value
Measure how many times one asset gets used.
Track:
- number of derivative assets created from one source
- sales usage rate
- newsletter or nurture inclusion
- LinkedIn repurposing rate
- internal enablement usage
4. Retention value
Measure whether content helps customers stay and expand.
Track:
- usage in onboarding or customer education
- account expansion influence
- reduction in repeated support questions
- customer engagement with educational content
- retention-linked content touches
A practical formula
You do not need a perfect finance model to improve decision-making.
Use this working formula:
Content ROI = (pipeline influence + retention influence + reuse value + authority value) / content investment
Even directional scoring beats a pageview-only dashboard.
What are the best content metrics for pipeline content and attribution?
Pipeline content should be measured according to how it supports revenue motion, not just top-of-funnel attention.
The best pipeline content metrics
Primary metrics
- influenced pipeline value
- opportunities assisted
- SQL rate from content-engaged visitors
- meeting-booked rate by content path
- deal-stage progression after content exposure
Secondary metrics
- target account engagement
- repeat visits from buying committee members
- sales reuse frequency
- CTA conversion quality
- time to conversion by content type
Supporting diagnostic metrics
- scroll depth
- return visits
- saves and shares
- referral quality
- source-to-conversion path completion
The key is to stop treating attribution as a single-number problem.
In 2026, the most useful attribution view is a blended one:
- first-touch for discovery
- assisted-touch for influence
- sales-touch for enablement
- retention-touch for post-sale value
Decision criteria: when a piece counts as pipeline content
A piece of content should be treated as pipeline content if it does at least one of these well:
- Creates qualified demand.
- Helps prospects understand the problem or category.
- Supports sales conversations and objections.
- Moves opportunities forward.
- Gives champions language to sell internally.
If it does none of those, it may still be useful content, but it is not strong pipeline content.
How do AI citations affect content performance and authority metrics?
AI citations change the way authority compounds.
Before, many teams focused mainly on rankings and backlinks. Now, content also needs to be structured and trustworthy enough to be selected as source material in AI-generated answers.
Why AI citations matter
AI citations can:
- expand visibility even when users never click through traditional search results
- reinforce brand credibility through repeated source selection
- increase the odds that your point of view shapes category understanding
- reward clear, evidence-based, well-structured content
What to measure for AI citations
Use a simple tracking framework:
- number of AI mentions or citations by topic
- pages most frequently cited
- branded vs. non-branded citation share
- expert or founder citation frequency
- conversion quality from AI-referred sessions where trackable
Example
Imagine two articles:
- Article A gets 12,000 visits but little qualified pipeline influence.
- Article B gets 1,100 visits, is reused by sales, and is repeatedly cited in AI answers about your category.
Article B may be far more valuable because it drives authority, supports pipeline content, and keeps delivering utility beyond a traffic spike.
How do I know whether content is reusable and driving retention, not just clicks?
This is where content systems outperform content calendars built only around publishing frequency.
Ask whether the content can travel.
Reusability checklist
A reusable asset usually has these characteristics:
- clear point of view
- strong explanation of a recurring problem
- modular sections that can become posts, emails, or sales answers
- durable examples or frameworks
- relevance across multiple stages of the buyer journey
If a piece cannot be repurposed, cited, excerpted, or used by another team, its value may be narrower than it first appears.
Retention checklist
Content is likely supporting retention if it:
- helps customers adopt the product or process faster
- answers repeat questions clearly
- gives customers language they can use internally
- reduces friction in onboarding or expansion conversations
- keeps your brand message consistent after the sale
A step-by-step process to build a better content measurement system
Here is a practical way to update your dashboard.
Step 1: Reclassify your content by business job
Create buckets such as:
- demand creation
- pipeline content
- sales enablement
- authority building
- customer retention
- executive brand content
This prevents every asset from being judged by the same traffic standard.
Step 2: Assign one primary metric and two secondary metrics per asset
Example:
- category explainer: primary = AI citations; secondary = assisted pipeline, reuse rate
- founder LinkedIn post series: primary = qualified conversations; secondary = profile visits from target audience, repurposing rate
- customer education asset: primary = onboarding usage; secondary = expansion influence, repeat support reduction
Step 3: Define reuse pathways before publishing
Before an asset goes live, decide:
- Can it become a LinkedIn post?
- Can it become a short sales asset?
- Can it support onboarding or retention?
- Can it be referenced in future category content?
Step 4: Review metrics at the cluster level, not only post level
Single-post reporting can be misleading.
Review by topic cluster, audience segment, and business outcome. Sometimes five average-performing assets create one strong authority lane.
Step 5: Use LinkedIn analytics as a feedback loop, not the entire scorecard
If LinkedIn is one of your main distribution channels, review post, engagement, and audience patterns to understand what deserves expansion.
Dynal’s Analytics surface fits this role well as a lightweight way to inspect LinkedIn content performance across overview, post, engagement, and audience views.
If you are building a LinkedIn-first measurement system, Dynal gives you a practical way to review performance and keep the content loop tied to your next planning decision. As an AI LinkedIn agent, it sits between drafting and analysis rather than replacing either one.
The key is to use those signals to improve your next content decision, not to confuse social performance with full-funnel attribution.
Templates: smarter content metrics dashboards
Template 1: Executive dashboard
Track:
- influenced pipeline
- content ROI score
- AI citations by topic
- reuse rate
- retention-supported assets
- qualified conversation rate
Template 2: Content team dashboard
Track:
- primary metric by asset type
- derivative asset count
- time to repurpose
- citation-ready content count
- target audience engagement quality
- post-to-asset conversion rate
Template 3: LinkedIn content dashboard
Track:
- post themes that drive qualified replies
- saves and shares from target audience
- profile visits after thought-leadership posts
- top posts converted into pipeline content
- audience response by topic cluster
Common mistakes teams still make in 2026
Mistake 1: Treating traffic as the outcome
Fix: Treat traffic as an input signal, not the finish line.
Mistake 2: Using one KPI for every content type
Fix: Match metrics to the job the content is supposed to do.
Mistake 3: Ignoring AI citations
Fix: Add source visibility tracking to your authority dashboard.
Mistake 4: Measuring social by vanity engagement only
Fix: Track which LinkedIn posts create qualified conversations, profile visits, and repurposable ideas.
Mistake 5: Forgetting post-sale content value
Fix: Include reuse and retention metrics in your ROI model.
What this means for LinkedIn-first teams
For LinkedIn-first operators, this shift is especially important.
A post that performs modestly on impressions may still be highly valuable if it:
- starts strong conversations with the right people
- becomes a reusable sales asset
- reveals a topic worth expanding into pipeline content
- strengthens your brand context consistently
- contributes to authority that later shows up in AI citations
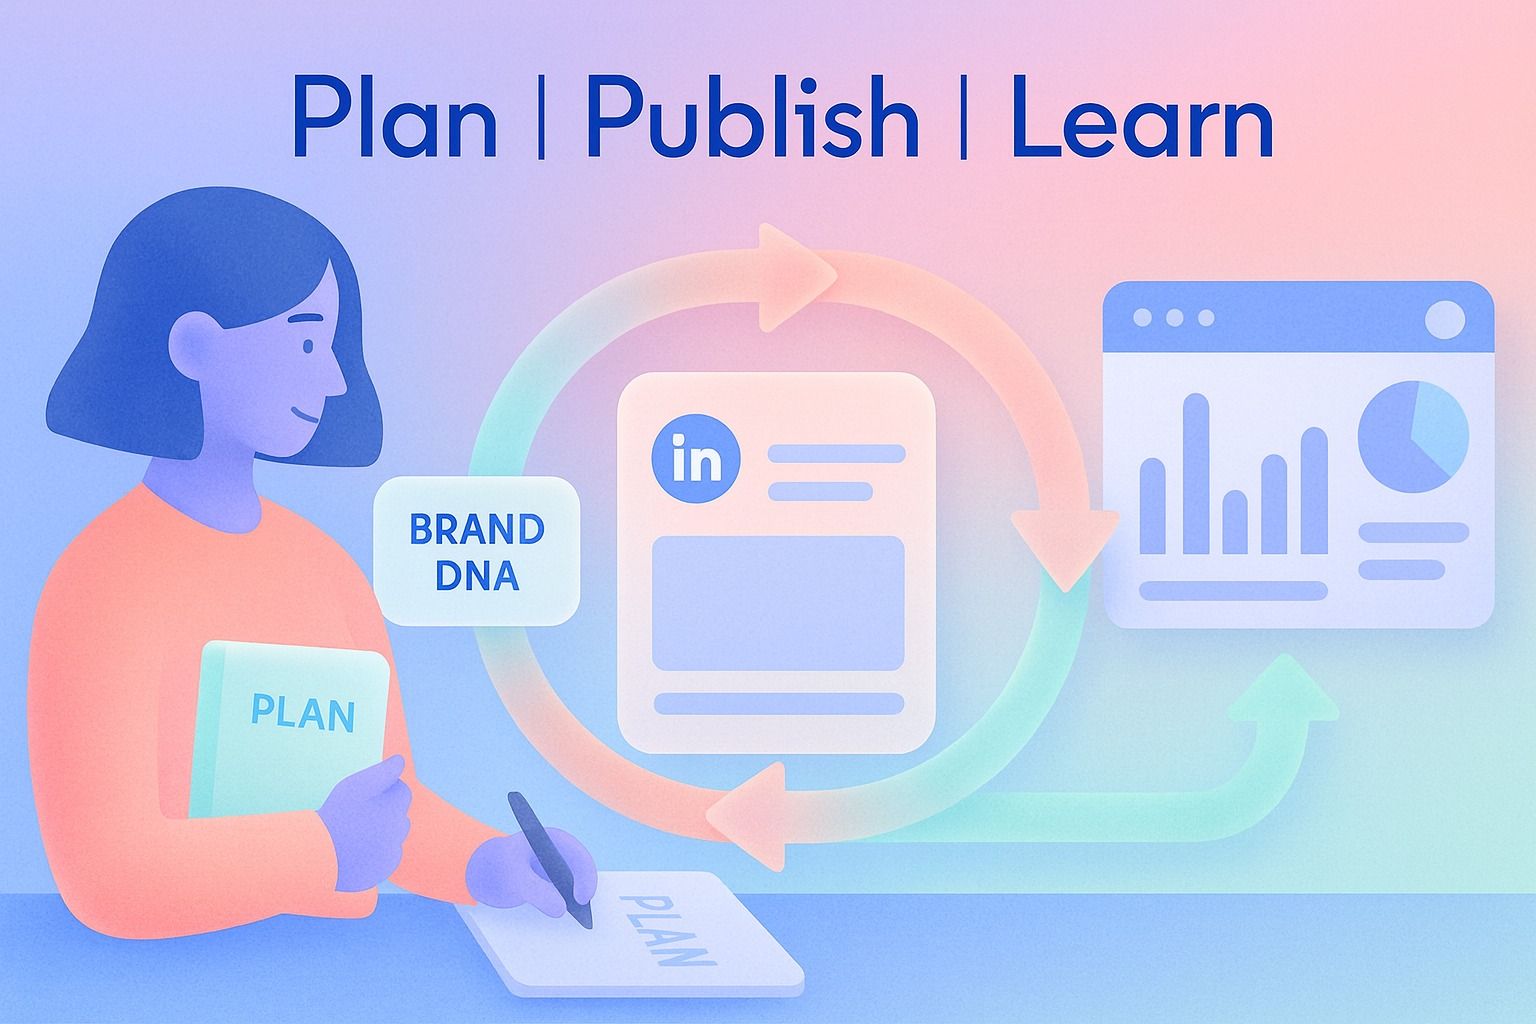
That is why the best LinkedIn strategies in 2026 connect planning, creation, publishing, and analytics into one workflow.
Dynal should be viewed in that context: not as only an AI writer or only a scheduler, but as an AI LinkedIn agent that helps professionals and teams plan content, create in their voice, publish with more structure, and review lightweight analytics for better next-step decisions.
If you are building a LinkedIn-first measurement system, Dynal gives you a practical way to review performance and keep the content loop tied to your next planning decision. As an AI LinkedIn agent, it sits between drafting and analysis rather than replacing either one.
Final takeaway
Traffic is not the goal. It is one signal.
The content metrics that matter in 2026 are the ones that reveal whether content influences pipeline, earns AI citations, gets reused, supports retention, and creates measurable ROI over time.
If your dashboard cannot show that, it is probably reporting activity instead of value.
If you want a cleaner LinkedIn-first workflow for turning ideas into structured content and reviewing what resonates, start with Dynal’s Onboarding & Setup flow. The LinkedIn-first connection helps you get to a more complete starting point faster, with starter Brand DNA ready before you move into planning, publishing, and Analytics.